
Dr David Booth FHEA FSS
Senior Lecturer
Associate Dean for Quality Assurance and Enhancement
Contact
Biography
Current Associate Dean for Quality Assurance & Enhancement at the School of Life Science at Dundee. Studying at R.B.A.I. and subsequently the Queen’s University of Belfast, his subject matter expertise is evolutionary biology with a strong focus on genetics and the statistical analysis of data. He has worked as a geneticist, researching sustainable fisheries at the Department of Agriculture and Rural Development for Northern Ireland; is a fellow of the Royal Statistical Society; has analysed and published on ancient DNA and invasive species; and has communicated science to the public through BBC NI, BBC Radio Ulster and BBC 1 science programming.
At Dundee he has demonstrated an ongoing commitment to collegiality and have been active in several cross-school projects. Notably the Enhancement-led Institutional Review (2013); several periodic programme reviews (2014-2018); with the Quality assurance team on a degree board convenorship review (2017); Senatus Academicus; the QAA data champions group (2019-2020); and as data lead for Transforming the Experience of Students through Assessment (TESTA), which has become an integral element of programme review across the university.
Research
Collaborative work with colleagues and both post-graduate and undergraduate students.
Topics ranging through statistics education, cell biology, biometrics, nature connection and socio/psychometrics.
Selected Publications
- Defining Activity Thresholds Triggering a ‘Stand Hour’ for Apple Watch Users: Cross-Sectional Study. Lyons, K. , Hei Man, A. H., Booth, D. & Rena, G., 10 Jun 2024, In: JMIR Formative Research. 8, 11 p., e53806.
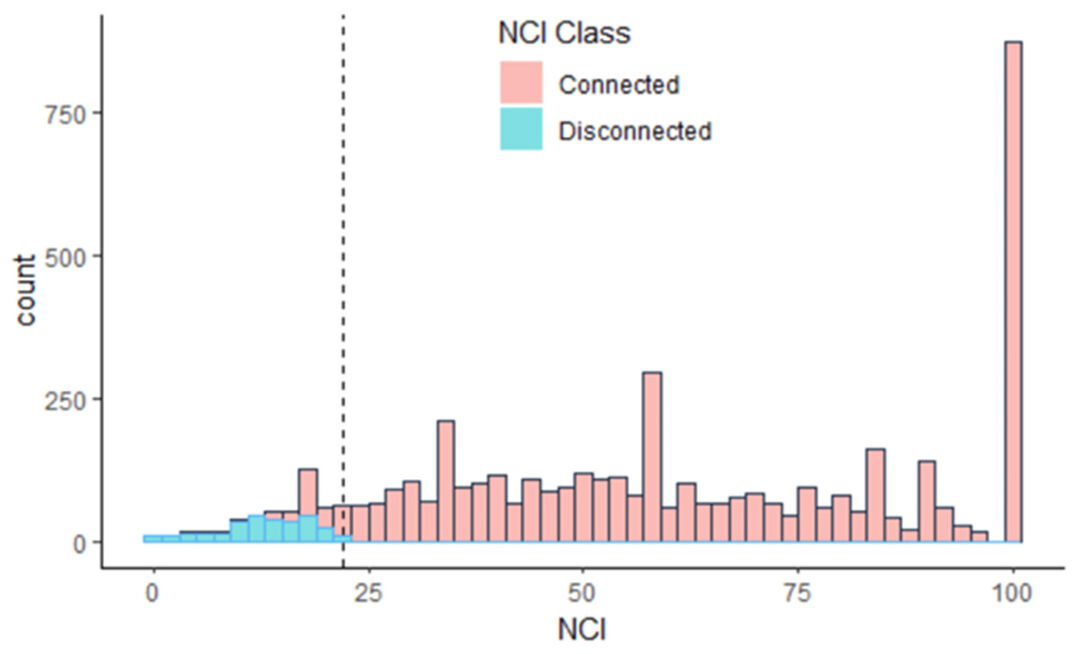
- Disconnected: What Can We Learn from Individuals with Very Low Nature Connection? Barrable, A. & Booth, D., 1 Jul 2022, In: International Journal of Environmental Research and Public Health. 19, 13, 9 p., 8021.
- Supporting Child and Family Wellbeing through Nature during the Pandemic. Barrable, A. , Moseley, P., Touloumakos, A. K. & Booth, D., 2021, In: Hellenic Journal of Psychology. 18, 2, p. 154-171
- Increasing nature connection in children: A mini review of interventions. Barrable, A. & Booth, D., 19 Mar 2020, In: Frontiers in Psychology. 11, p. 1-7 7 p., 492.
- Identification of a SARS-like bat coronavirus that shares structural features with the spike glycoprotein receptor binding domain of SARS-CoV-2. Bringas, C. F. & Booth, D., 2020, In: Access Microbiology. 2, 11, 8 p., 000166.
- Nature Connection in Early Childhood: A Quantitative Cross-Sectional Study. Barrable, A. & Booth, D., Jan 2020, In: Sustainability. 12, 1, p. 1-15 15 p., 375.
- Tracking biological invasions in space and time: elucidating the invasive history of the green alga Codium fragile using old DNA. Provan, J. , Booth, D., Todd, N. P., Beatty, G. E. & Maggs, C. A., 2008, In: Diversity and Distributions. 14, 2, p. 343-354
- Molecular approaches to the study of invasive seaweeds. Booth, D., Provan, J. & Maggs, C. A. (Lead / Corresponding author), 2007, In: Botanica Marina. 50, 5-6, p. 385-396
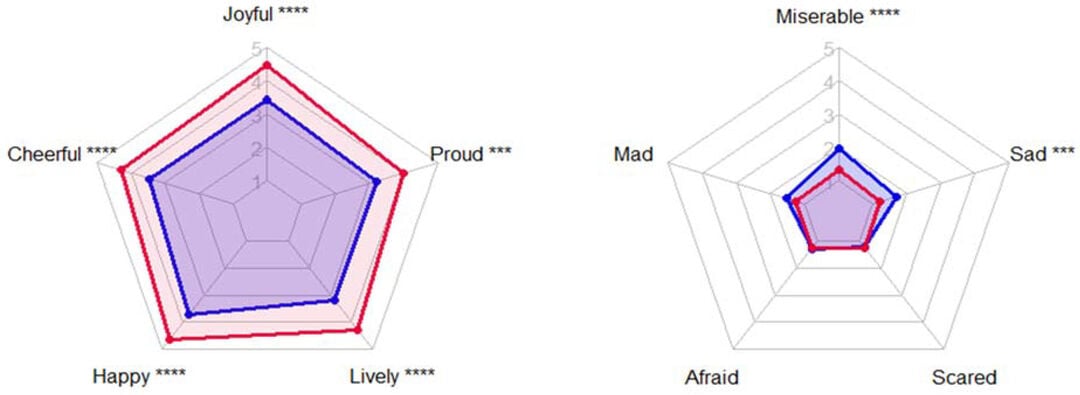
Exemplar analytics from published work:
Teaching
As an educator, I have strived to engage with students at every stage of learning post-primary, and have tailored my teaching style towards a “What I cannot create, I do not understand” ethos. I have actively engaged with the more recognisably challenging aspects of any biology course, namely genetics and statistics; and in the accreditation of degree courses at Dundee my efforts were recognised as several of the points of good practice noted by the Royal Society of Biology. I feel strongly that developing such skills in a safe, simulated settings with subsequent practice and application, ultimately leads to a cold understanding and intuition in the early years; paying dividends many times over when students engage with their capstone research work at honours level.
Teaching Modules
- 1st Year BI10002 Evolution and Biodiversity and BI12004 Environmental Biology
- 2nd Year BI21008 Diversity of Life, BI22055 Animal Function and EV22002 Mechanisms and Measurements
- 3rd Year BI32028 Ecology and Conservation Biology
Modules I lead on
Awards
| Award | Year |
|---|---|
| Teaching Award for Good Practice / (Highly Commended) | 2016 |
| Teaching Award for Good Practice | 2016 |
Stories
- Type
- News
Double win at student-led teaching awards
Dr David Booth and Dr Claire Hepburn were named amongst the winners of the annual Dundee University Student Association (DUSA) student-led teaching awards.
- Type
- News
Life Sciences staff make DUSA Student Led Teaching Awards shortlist
Life Sciences staff make DUSA Student Led Teaching Awards shortlist
- Type
- Press release
Graduate has COVID-19 research published in microbiology journal
A University of Dundee graduate has discovered key information that will help scientists better understand the virus responsible for the Covid-19 pandemic